Joe Zidle and Byron Wien: Turbulence Shakes Opportunities Loose
February turned out to be brutal as inflation indicators made it obvious that the path lower would be far from a straight line. Then the calendar flipped to March and the regional bank crisis added new uncertainties about the rate path of the Federal Reserve. Byron puts the case for inflation’s “stickiness” into perspective and plots the factors that he expects to dictate its trajectory, and the Fed’s moves to rein it in.
For investors, fear is a natural reaction to these conditions, but Joe writes that it doesn’t have to be. He reminds us that pragmatism is always an appropriate approach. The next generation of returns will look different than the previous cycle’s. This requires investors to adjust from the liquidity era when “diversification” seemed to be achievable with just two asset classes–stocks and bonds. He highlights why an active approach to capital allocation is likely to shine, especially when it’s deployed to the market’s “good neighborhoods.” Finally, they discuss how private market strategies have historically achieved attractive risk-adjusted returns across cycles, with lower realized volatility than certain public asset classes.
Taylor Becker provided critical assistance in the research for and writing of this essay.
Sentiment Sours as Inflation Proves Sticky
by Byron Wien, Vice Chairman, Private Wealth Solutions
During January the mood was generally positive; inflation was coming down, the unemployment rate was low and there was continued talk of the possibility of a soft landing, wherein the economy could avoid recession. During February, however, two events took place that changed the mood. The first was the nonfarm payroll report of 517,000 new jobs created in January, which indicated that the economy was still strong and that inflation was likely to remain an issue. The second was the Personal Consumption Expenditure Price report, which is the Federal Reserve’s preferred inflation indicator. It came in at a 7% headline annual rate, but 4.7% ex-shelter.
Whereas in January, investors could speculate that inflation was on a favorable trajectory toward a low-single-digit rate, it now appeared that inflation would continue to be a serious problem. Investors were also speculating on hope that the Fed could soon pause its tightening because it had accomplished its mission, or at least was making sufficient progress. During a pause, they could wait to see if the favorable trend in inflation continued. Some bullish observers even thought it possible that during the year the Fed would pivot toward cutting rates. The equity market rallied, and at one point the S&P 500 was up 8%, though only eight (mostly technology) stocks accounted for much of the gain.
Suddenly, instead of talking about a pause or pivot, investors began to expect continued 25 basis-point increases, or even 50bps in March. When the Strategy Team was working on The Ten Surprises of 2023, we considered the possibility of a 6% federal funds rate but rejected the idea because it was too extreme.
By the beginning of March, a terminal rate of 6% was being discussed as a realistic end point. The impact of higher interest rates was almost immediately reflected in the equity market. High-multiple technology-related stocks were hit hardest, and the market overall lost ground. There was no additional talk of a soft landing. Investors generally seemed to accept the idea that a recession was likely, and the question was “when” not “if”. Other unfavorable factors entered the discussion. The inverted yield curve, which had shown to be a predictor of every post-war recession when it persisted more than two weeks, became another warning. It has historically had a lead time ranging from around a year to a little longer. The pattern will not necessarily hold in terms of timing the start of the next recession, but if it did, it would imply either later this year or early next year. Another warning factor is that the fed funds rate will be higher than real GDP growth, and if inflation comes down to 4% then real yields are likely to be positive.
Finally, the regional bank crisis, exemplified by the failure of Silicon Valley Bank, caused a seismic shift in Treasury yields and investor expectations for the direction of Fed policy. The 2-year Treasury yield dropped by the most since “Black Monday” in October 1987, and markets began pricing an immediate end to the Fed’s hiking cycle. The timely February inflation data showed that the Consumer Price Index continues to increase at an uncomfortable rate, especially on a core basis (excluding food and energy), which surprised slightly to the upside. This result supports our view that inflation remains sticky and that the Fed will think it has more to do to rein it in.
When we assess the likely trajectory for inflation, there are three key components to consider: commodities, wages and rents. Commodity prices have been coming down pretty much across the board. The mild winter allowed the upward pressure on energy prices to soften. We have also seen the price of some industrial materials like copper and lumber begin to decline. Supply chain disruptions have largely been relieved, which has helped inflation move lower. These are the “transitory” elements of inflation that have begun to be worked out of the system. Now, inflation is being driven by some of its stickier components, which may be more costly for which to solve. These are services inflation, like rents, and, closely related, the wage pressures being driven by a historically tight labor market.
During COVID, many American workers were laid off or worked remotely. When the economy opened up, many of these workers had saved up money during the pandemic and chose not to return to jobs they did not like. This may be one reason why the labor market is tight with roughly 1.7 job openings for every person looking for a job. Wage pressure is cited by certain surveyed Blackstone portfolio companies as one of the most significant problems they face in their operations.1 Some workers have been living off the savings they have accrued during the pandemic, but those have most likely become depleted by now. Household net worth is near an all-time high, so some potential workers may be willing to borrow against that to avoid going back to work.
We do not expect the upward pressure on wages to subside anytime soon, and we believe the Employment Cost Index will remain around 5%. Productivity is also a problem. Historically, improvements in productivity have held inflation down. One would have thought that fewer people returning to work would have resulted in those on the job doing more, but that has not been the case. The more experienced workers are the ones staying home, leaving less proficient workers to do the job. This adds to inflation insofar as it means even more labor demand when there is already a shortage of workers.
The third inflation factor is rent. The US has underbuilt its housing stock for a decade, causing pressure on rents as the population and household formations grew. With interest rates climbing, both single-family and multifamily construction are likely to be sluggish, and we expect the rent factor in the Consumer Price Index and Personal Consumption Index to remain at about 5% for some time. With two of the three inflation factors at 5%, it is unlikely that inflation can return to Fed Chair Jay Powell’s objective of 2% without some demand destruction.
Two additional factors may play a role in the inflation outlook. China is recovering from its COVID crackdown, which will put some upward pressure on commodity prices. Some manufacturers have moved production to India and other parts of Asia and Mexico. We will have to see what impact that has on import prices, but it is not likely to be favorable.
We also believe the direction of the federal budget deficit has an impact on inflation. Projected revenues are increasing at a 3.5% rate. Projected spending is increasing at a 4.9% rate. This year the budget deficit will be about $1.4 trillion, but it is projected to be $2.8 trillion a decade from now. Net interest payments were running at a $533 billion rate as of the beginning of the year, but they have risen since then. Today they are accounting for about 8% of the total budget, but in 2033 they are projected to be 14%. Mandatory spending on Social Security, Medicare and defense is about 60%. This leaves about 26% for discretionary spending, but that is expected to decline to 24% by 2033. The US government is committed to supporting the military effort in Ukraine and helping Taiwan improve its defense capability, both of which are likely to add to the deficit as well. So far the US has been able to continue to issue new debt without significant weakening in the dollar, but if that dynamic reversed, the result would be inflationary.
Return Generation: Next Decade Different than the Last
by Joe Zidle, Chief Investment Strategist, Private Wealth Solutions
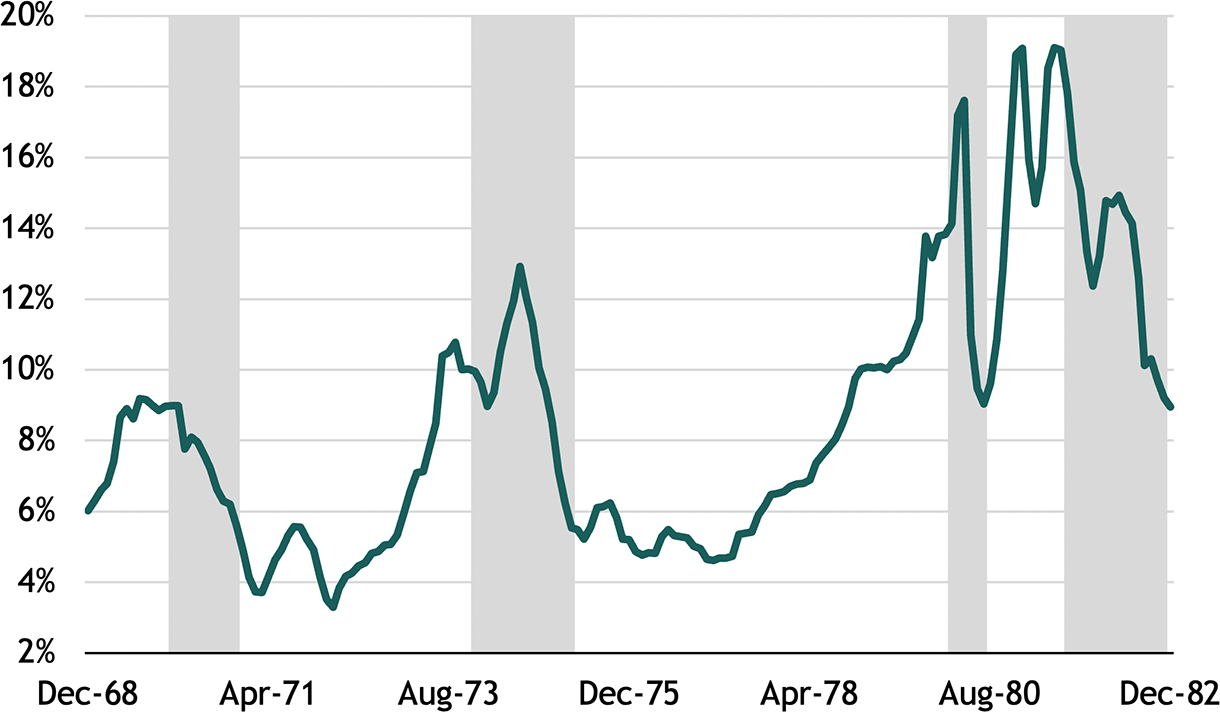
In the scenario Byron outlines above, the Fed likely tamps down inflation on a cyclical basis, but it may return quickly after the current hiking cycle concludes and the economy begins to reflate. One of my essays from last year explored how the next cycle may end up looking more like the 1970s than most people think. In examining the ’70s, considering the volatility of inflation and interest rates rather than absolute levels alone is useful. Large swings in inflation forced policymakers to adjust interest rates quickly—in both directions (see Figures 1 and 2).
Figure 1: US Core CPI in the 1970s2
(YoY)
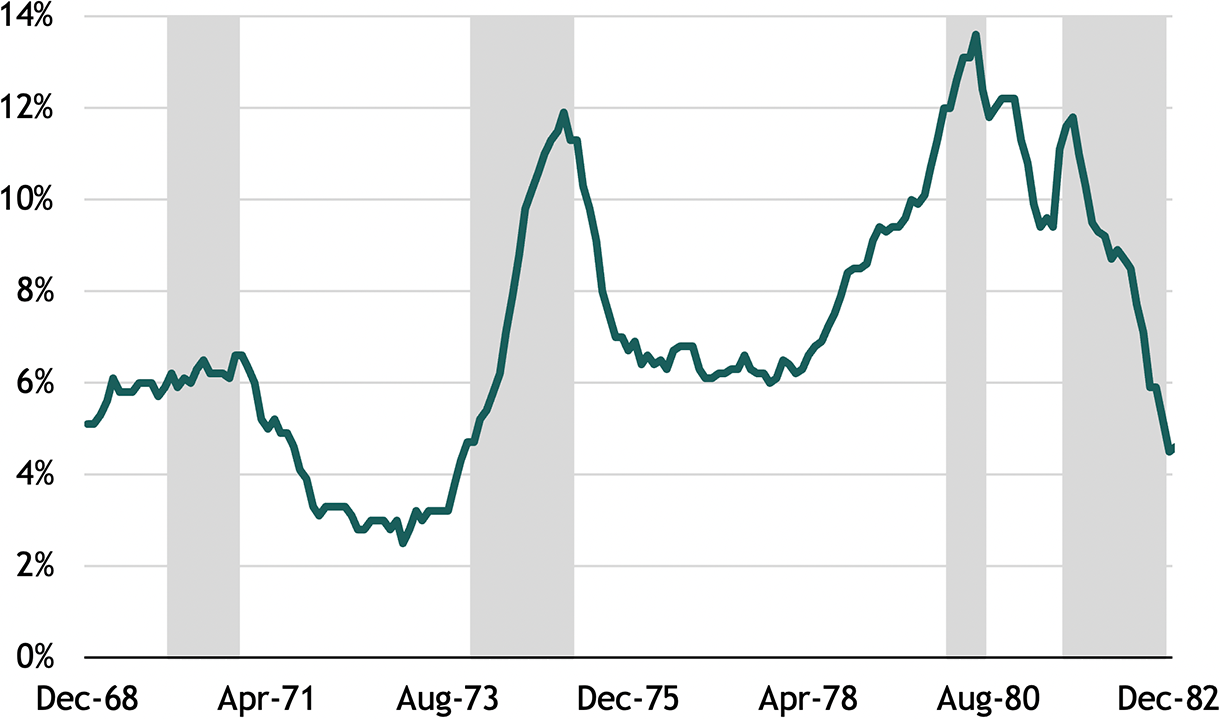
Figure 2: US Fed Funds Rate in the 1970s3
In contrast to the last cycle, which featured stability in inflation and rates, policymakers may be more aggressive in front-running potential inflationary flare-ups. Now that inflation has once again resurfaced, they will be loath to assume it is merely “transitory.”
The Strategy team expects that structurally higher inflation will prevent central banks from returning to zero rates and unlimited balance sheet expansion. For over a decade, abundant liquidity led to a massive bull market in most financial assets, dampening volatility and making it generally profitable to have high beta and long duration exposures. If we were correct that monetary policy will be less accommodative in the next cycle, then it’s likely that volatility will be higher, and that beta and duration will not be sure-fire ways of outperforming.
What we describe here remains out-of-consensus. The consensus view expects inflation, and rates, to generally drift back down and remain historically low. In our team’s view, a serious rethink is warranted, both on these assumptions and what they mean for portfolios.
Liquidity and the beta vs. alpha debate The proposition that liquidity drives performance is a widely recognized view. Over the last decade, stocks and bonds rose in tandem as financial assets outperformed the real economy. Multiple expansion, one of the byproducts of liquidity, was responsible for around 40% of the S&P 500’s historic 18% annual return from 2009 to 20204, and declining interest rates drove outsized bond returns. For example, the return on a long-duration Treasury portfolio was robust, at about 7% per annum5. For perspective, the dispersion between the best- and worst-performing managers in major stock and bond categories over the last 20 years was measured in basis points as everything moved “up and to the right.”
The reversal of central bank liquidity means that market beta is likely to become a headwind; average returns are likely to be lower, while the dispersion of returns should increase. Byron and I believe that active management and higher-conviction investing could be a main driver of performance over this next cycle, when investing in good neighborhoods gains importance in more-challenging operating conditions. These neighborhoods include sectors with secular growth and those that are levered to the real economy and can adjust to periods of volatile inflation and interest rates. In addition, operational expertise is likely to outperform financial engineering, as investors place a premium on high-quality balance sheets and strong cash flow growth, rather than relying on cheap money and “growth at all costs” to generate acceptable returns.
Stock-bond correlation rethink At the highest level, diversification is likely to look different if interest rates don’t return to the record low levels of the last cycle. In environments of higher inflation and rates, the traditional 60/40 portfolio mix would not necessarily reduce risk in the way that many investors have come to expect.
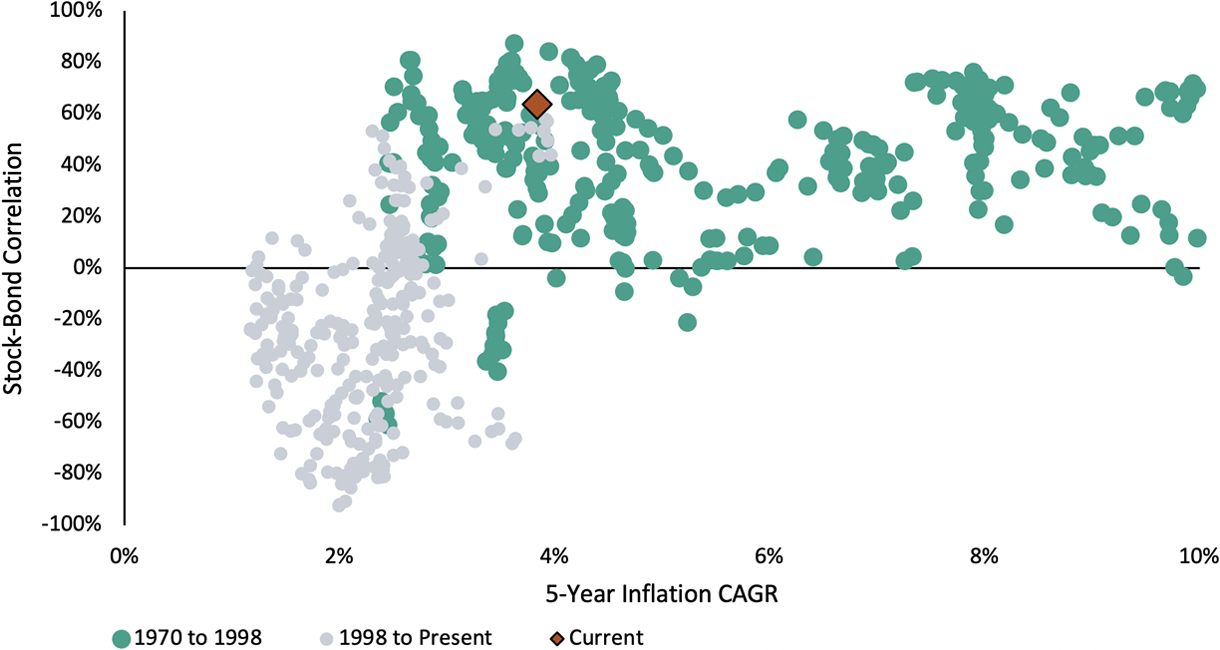
In Figure 3, we present stock and bond correlations in different inflation regimes. Historically, periods of higher inflation are associated with positive stock-bond correlations. It was only in the last 20 years or so, when inflation and rates were at record lows, that investors thought they could structure a “well-diversified” portfolio with just two asset classes. While the historic underperformance of the 60/40 portfolio in 2022 is unlikely to be matched anytime soon, we do not believe the structural challenges to that strategy are over.
Figure 3: Stock-Bond Correlations in Different Inflation Regimes6
(Trailing 12-month Correlation)
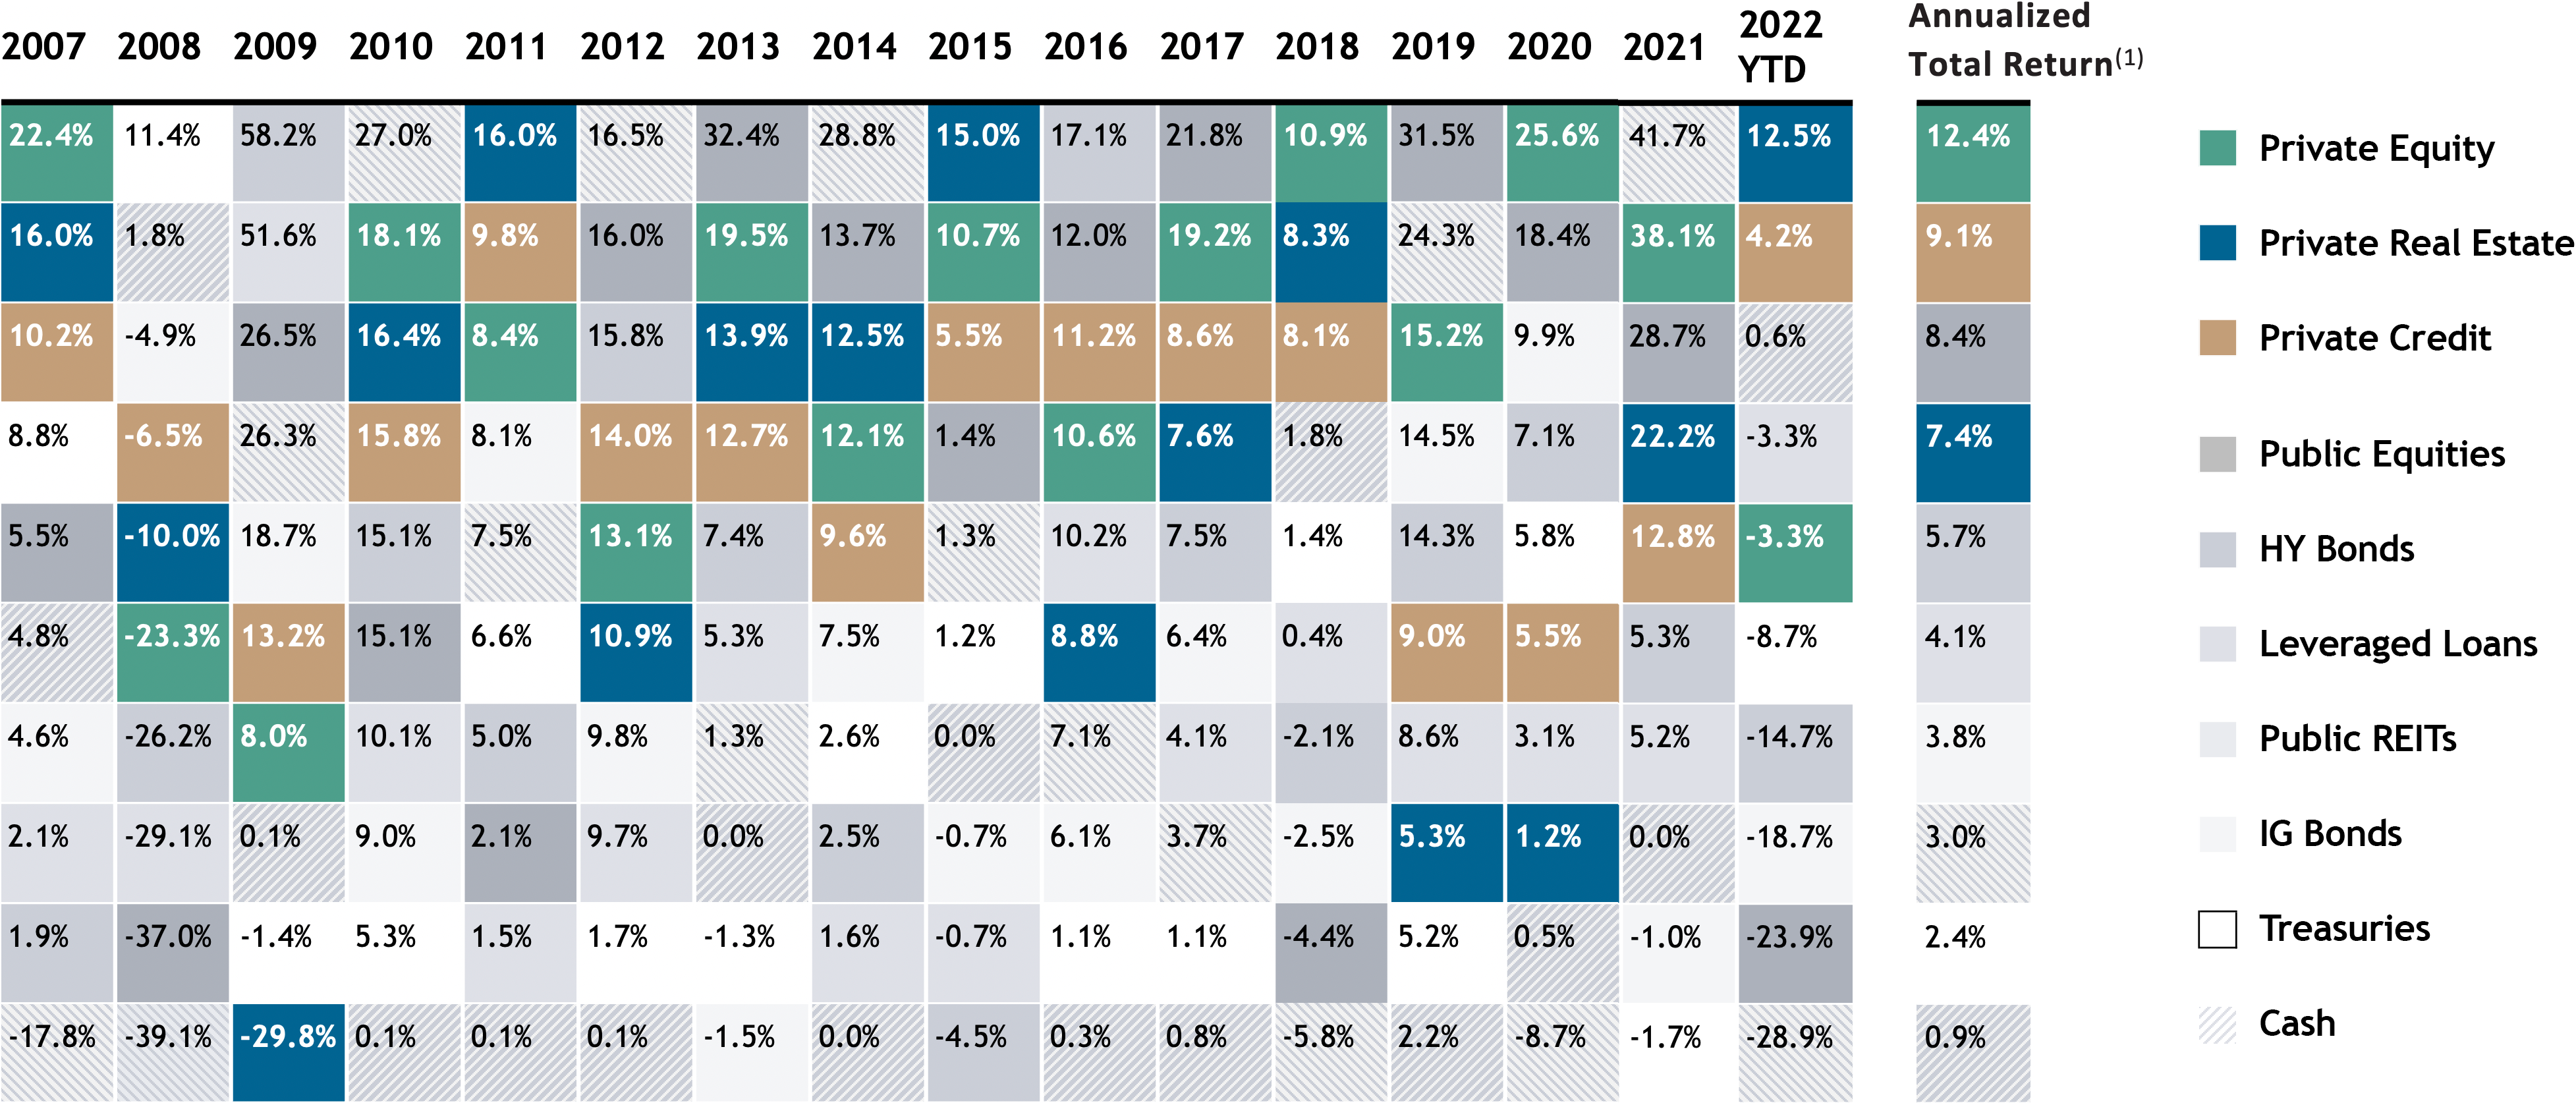
To achieve proper diversification and attractive risk-adjusted returns, a broader set of tools should be included in the mix. Below we put a spin on the typical return quilt by adding private equity, private real estate and private credit. Over the long term, private market strategies can provide attractive risk-adjusted returns across cycles and help dampen volatility relative to a strict reliance on traditional strategies like the 60/40 portfolio. And while cash might seem like a safe place to hide from volatility, the long-term underperformance of cash as an asset class shows that it’s not a reliable strategy for generating investment returns.
Relative to the last cycle, returns over the next cycle are likely to be muted across the board, in our view. By muted, we mean a step function lower than the low- or mid-double-digit returns in equities and the high-single-digit returns for traditional fixed income in the last bull market. However, Byron and I expect that the illiquidity premiums and potentially lower volatility earned through private market investments should persist. One important reason is that private market investors have more control over their outcomes. It’s the “buy it, fix it” model—private market investors with operational expertise can intervene to change the course of their investment in a way that minority investors in a public company simply cannot.
Figure 4: Annual Returns of Key Indices, Ranked in Order of Performance7
(2007-Q3’22)
Dislocation = opportunity Smart investors with patient capital can view recent volatility at a safe remove, unworried by the daily vagaries of the markets and unconcerned about the fool’s errand of market timing. This environment is where active, high-conviction investing can outshine passive strategies that are subject to the moods of the public markets and that struggle to differentiate themselves in a challenging macro environment.
Investors could be well-compensated for using these periods of dislocation to deploy capital into good neighborhoods at attractive valuations. Sectors and companies with secular growth potential and the ability to navigate inflation and interest rates are likely to have a leg up. Across asset classes, high quality balance sheets, cash flow growth and duration management are likely to be some of the most important variables to consider when seeking attractive risk-adjusted returns.
In investing, volatility is inevitable. Panic is not. Market dislocations can be opportunities if you let them, but this requires patience and a steady hand.
- The Blackstone survey of a subset of portfolio company CEOs referred to herein reflects input from 86 Blackstone portfolio companies (52 U.S. CEOs), largely within Blackstone’s Private Equity and Real Estate businesses (the “CEO Survey”). The CEO Survey was initiated on December 5, 2022 and closed December 19, 2022. The responding portfolio companies are not necessarily a representative sample of companies across Blackstone’s portfolio. The views expressed by responding portfolio companies in the CEO Survey do not necessarily reflect the views of Blackstone.
- Source: US Bureau of Labor Statistics and Macrobond, as of 12/31/1982
- Source: Federal Reserve and Macrobond, as of 12/31/1982
- Represents the annual return for the S&P 500 calculated from 3/6/2009 to 8/31/2020
- Represents the annual return for the iShares 20+ Year Treasury Bond ETF calculated from 3/6/2009 to 8/31/2020
- Source: Blackstone Investment Strategy, Bureau of Labor Statistics, Ibbotson Associates, Morningstar and Bloomberg, as of 2/28/2023. Stocks and bonds are represented by the S&P 500 Index and the IA SBBI US Long-Term Government Bond Index, respectively. Correlations are trailing twelve-month, based on monthly returns from 1970 to present.
- Source: Bloomberg and Preqin, as of 9/30/2022. Represents total returns for the respective calendar year, ranked in order of performance. Annualized total return is calculated over the period 1/1/2007 to 9/30/2022. Asset classes presented are based on the following indices: Preqin Private Equity Quarterly Index for “Private Equity”, S&P 500 Index for “Public Equities”, NCREIF ODCE Index for “Private Real Estate”, Cliffwater Direct Lending Index for “Private Credit”, Bloomberg U.S. Corporate High Yield for “HY Bonds”, Morningstar LSTA US Leveraged Loan Index for “Leveraged Loans”, Bloomberg U.S. Corporate Bond Index for “IG Bonds”, MSCI US REIT Index for “Public REITs”, Bloomberg U.S. Treasury Bill 1-3 Month Index for “Cash”, Bloomberg U.S. Intermediate Treasury Index for “Treasuries”. Past performance is not necessarily indicative of future results. There can be no assurance any alternative asset classes will achieve their objectives or avoid significant losses. The volatility and risk profile of the indices is likely materially different from that of a fund. The indices employ different investment guidelines / criteria than a fund and do not employ leverage; a fund’s holdings and the liquidity of such holdings may differ significantly from securities comprising the indices. The indices aren’t subject to fees / expenses, and it may not be possible to invest in the indices. The indices’ performance has not been selected to represent an appropriate benchmark to compare to a fund’s performance, but rather is disclosed to allow for comparison to that of well-known and widely recognized indices. A summary of the investment guidelines for the indices are available upon request. In the case of equity indices, performance of the indices reflects the reinvestment of dividends. The indices are not necessarily the top performing indices in the given asset class and recipients should consider this when comparing the performance of any fund or investment to that of the indices. See “Important Disclosure Information,” including “Index Comparison.”
- Annualized total return is calculated over the period 1/1/2007 to 9/30/2022.
The views expressed in this commentary are the personal views of Byron Wien, Joe Zidle, and Taylor Becker and do not necessarily reflect the views of Blackstone Inc. (together with its affiliates, “Blackstone”). The views expressed reflect the current views of Byron Wien, Joe Zidle, and Taylor Becker as of the date hereof, and neither Byron Wien, Joe Zidle, Taylor Becker, or Blackstone undertake any responsibility to advise you of any changes in the views expressed herein.
The Blackstone survey of a subset of portfolio company CEOs referred to herein reflects input from 86 Blackstone portfolio companies (52 U.S. CEOs), largely within Blackstone’s Private Equity and Real Estate businesses (the “CEO Survey”). The CEO Survey was initiated on December 5, 2022 and closed December 19, 2022. The responding portfolio companies are not necessarily a representative sample of companies across Blackstone’s portfolio. The views expressed by responding portfolio companies in the CEO Survey do not necessarily reflect the views of Blackstone.
Blackstone and others associated with it may have positions in and effect transactions in securities of companies mentioned or indirectly referenced in this commentary and may also perform or seek to perform services for those companies. Blackstone and others associated with it may also offer strategies to third parties for compensation within those asset classes mentioned or described in this commentary. Investment concepts mentioned in this commentary may be unsuitable for investors depending on their specific investment objectives and financial position.
Tax considerations, margin requirements, commissions and other transaction costs may significantly affect the economic consequences of any transaction concepts referenced in this commentary and should be reviewed carefully with one’s investment and tax advisors. All information in this commentary is believed to be reliable as of the date on which this commentary was issued, and has been obtained from public sources believed to be reliable. No representation or warranty, either express or implied, is provided in relation to the accuracy or completeness of the information contained herein.
This commentary does not constitute an offer to sell any securities or the solicitation of an offer to purchase any securities. This commentary discusses broad market, industry or sector trends, or other general economic, market or political conditions and has not been provided in a fiduciary capacity under ERISA and should not be construed as research, investment advice, or any investment recommendation. Past performance is not necessarily indicative of future performance.
For more information about how Blackstone collects, uses, stores and processes your personal information, please see our Privacy Policy here: www.blackstone.com/privacy.