
Pattern Recognition
To receive the latest Pattern Recognition straight to your inbox Subscribe Here
Insights from the World’s Leading Alternative Asset Manager
July 29, 2026
Strength Across the US Economy
July 29, 2026
Strength Across the US Economy
- We see economic momentum continuing to build. Blackstone US portfolio company revenue grew +12% YoY in 2Q26, accelerating from +7% two years ago. [ 1 ]
- Growth was broad-based, with the strongest performance in companies linked to energy, electrification, and digital infrastructure value-chains, while EBITDA margins expanded to their highest level in at least three years. [ 1 ]
- Business confidence is strong: 96% of CEOs surveyed from Blackstone portfolio companies expect business conditions to remain steady or improve over the next 6-12 months. [ 2 ]
Blackstone US PE Portfolio Companies Revenue Growth
YoY
Source: Reflects Blackstone proprietary data for Q2 2026, Q2 2025, and Q2 2024 (each as of July 16, 2026, from 44 US BCP portfolio companies). Excludes select public investments, select FIG investments, certain new investments, investments where YoY growth rates are not comparable due to divestitures and certain other companies for which timely forecasts are unavailable.
July 10, 2026
AI Buildout Is Creating Jobs
July 10, 2026
AI Buildout Is Creating Jobs
- We are seeing the early signs of a broader blue-collar job renaissance, driven by the scale and labor-intensity of the AI infrastructure build-out.
- At QTS, our data center developer, the number of US data center construction workers is expected to nearly triple — from 13k at the beginning of last year to 40k by year-end. [ 1 ]
- That demand is translating into strengthening wage growth in hard-asset businesses across our portfolio. [ 2 ]
Construction Workers on Site at QTS US Data Centers
(Number of workers)
Source: Blackstone proprietary data.
June 10, 2026
Capital Markets Remain Healthy
June 10, 2026
Capital Markets Remain Healthy
- Capital markets are experiencing real momentum. In the year to date, US IPO volumes jumped 186% and announced M&A volumes rose 64% YoY, a sign that companies and investors are engaged with public and strategic markets.
- We see strong investor appetite for quality companies, with markets remaining open and selective despite global disruptions and heightened volatility. Investors are focused on durable businesses, especially AI beneficiaries or those less exposed to disruption.
- We continue to see strength in capital markets for businesses in the right neighborhoods — reflected in Blackstone’s IPO pipeline, with three IPOs successfully priced in the last month, seven more companies in the pipeline, and smaller minority interests in three other large technology firms likely to go public this year.
Source: Dealogic, KBW Research. IPO data inclusive of SPACs and A-shares and represents year-to-date cumulative activity through June 8, 2026, compared to prior year. M&A data represents year-to-date cumulative activity through June 4, 2026, compared to prior year. IPO pipeline includes Blackstone Proprietary Data as of June 9, 2026.
May 11, 2026
The US Economy Remains Resilient
May 11, 2026
The US Economy Remains Resilient
- Economic activity remains resilient, despite geopolitical uncertainty. Blackstone US portfolio company revenue growth accelerated to 11% YoY in 1Q26, up from 8% a year ago — a positive signal of broader market resilience.[ 1 ]
- Surveyed CEOs from Blackstone’s portfolio, which consists of 270+ portfolio companies, are optimistic. More than 90% of leaders say they expect business conditions to remain steady or improve over the next 6–12 months.[ 2 ]
- The AI CapEx cycle continues to drive outsized growth. We are seeing strong performance across data center, energy, and electrification-linked portfolio companies.[ 1 ]
Blackstone US PE Portfolio Companies Revenue Growth [ 1 ]
YoY
April 27, 2026
Warehouse Demand Rises
April 27, 2026
Warehouse Demand Rises
- Walmart’s path to a $1T market cap has been fueled by its e-commerce sales growth, with Q4 marking their 15th consecutive quarter of 10%+ YoY growth. [ 1 ]
- More online orders = more warehouses; case in point, Walmart’s US warehouse footprint has grown 34% since 2018, while its retail space fell 1%. [ 1 ]
- Faster online delivery speeds are also driving higher demand; Amazon Prime’s US same or next day deliveries grew 30% YoY in 2025 and we estimate that 2-day to <24-hr delivery requires 4x more warehouse space. [ 2 ]
- These trends, combined with historic US nearshoring and AI CapEx, are driving strong performance for warehouses; we are seeing this in our own portfolio, with Link Logistics experiencing the strongest quarter of same-store leasing on record in Q4 (+38% YoY).
Walmart’s US Real Estate Footprint
(Cumulative % change in square feet from 2018-2025)
Source: Walmart public filings and MWPVL, as of December 31, 2025.
April 8, 2026
Today’s Private Credit Isn’t the GFC
April 8, 2026
Today’s Private Credit Isn’t the GFC
- In 2008, banks were levered anywhere from 25 to 40 times, primarily funded by short-term deposits and heavily exposed to subprime housing. [ 1 ] The underlying assets were 90%+ loan-to-value mortgages, layered with complex derivatives that obscured the risk. [ 2 ]
- Simply put, this in no way resembles what is happening today.
- In private credit, Business Development Companies (BDCs) typically borrow less than 1x their own capital. [ 3 ] They use structures that don’t rely on deposits or overnight capital. And they lend to companies, not subprime homeowners, usually only around 40% of what the business is worth. [ 4 ]
Leverage Utilized
(GFC vs. today)
Source: Investment Banks 2007: Financial Markets Regulation, GAO report, published July 2009. Direct Lending Today: Blackstone Credit & Insurance views for typical direct lending vehicle.
March 13, 2026
Data Center Demand Surges
March 13, 2026
Data Center Demand Surges
- As AI usage continues to grow, so does the demand for data centers.
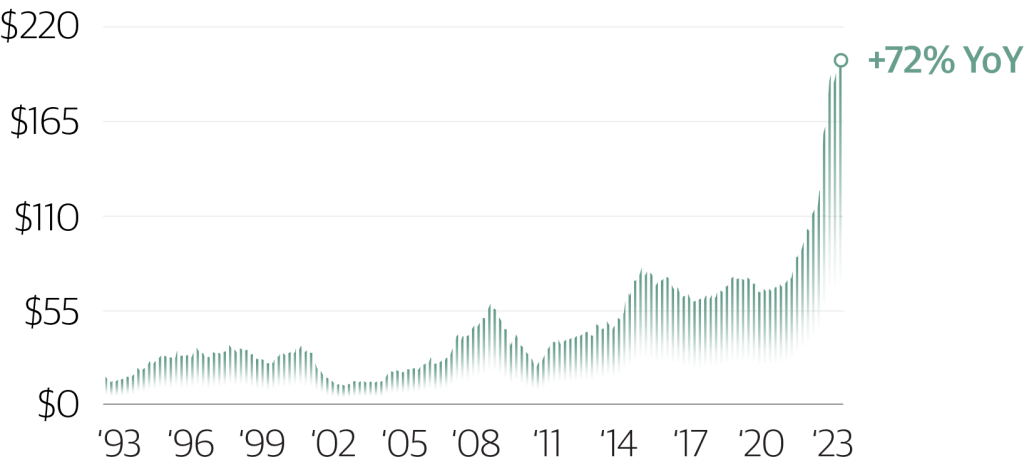
- US data center demand has surged over the past five years. The top 5 hyperscalers are projected to spend over $700B in 2026. [ 1 ]
- We see these patterns reflected in data from QTS, the world’s largest data center business and a Blackstone portfolio company. [ 2 ] QTS leasing volume is up 50%+ YoY in 2025, and we expect another strong year of growth in 2026.
QTS Cumulative Leased Capacity
Source: Blackstone Proprietary Data, as of December 31, 2025.
November 7, 2025
Positive Signals from Our Portfolio
November 7, 2025
Positive Signals from Our Portfolio
- While volatility, shifting policy, and shocks to sentiment have driven headlines in 2025, our data has shown consistent and positive demand growth – reinforcing our confidence in the investment landscape.
- Ahead of Q3 earnings, our US PE operating companies posted +9% YoY Flash revenue growth, the fastest rate in two years, while EBITDA margins expanded YoY for an 8th consecutive quarter to 35%. [ 1 ]
- The market is catching up to our view, and S&P earnings have echoed our early data: over 80% of companies are beating expectations. [ 2 ]
- Optimism from our surveyed companies has been on an upswing since April, with nearly 90% of responding CEOs expecting stable or improving business conditions over the next 12 months. [ 3 ]
Blackstone US PE Operating Portfolio Company Revenue Growth
% YoY
Source: Blackstone proprietary data as of September 30, 2025, from 39 BCP portfolio companies. Excludes select public investments, select FIG investments, certain new investments, investments where YoY growth rates are not comparable due to divestitures and certain other companies for which timely forecasts are unavailable.
September 5, 2025
Electricity Demand Rising Rapidly
September 5, 2025
Electricity Demand Rising Rapidly
- Data center development, electrification, and the reindustrialization of the US economy are collectively driving a step change in power demand.
- Across the US, there have been significant upward revisions to regional power demand forecasts compared to 3-5 years ago (the latest forecast roughly 11x greater or an 8% CAGR). [ 1 ]
- Meeting this rising demand will require huge amounts of investment to reinforce and upgrade the country’s aging electrical grid. Utilities are forecasted to invest $1.4T in the grid from 2025 to 2030 alone (equal to ~1.1x the market cap of the sector today). [ 2 ]
Projected Utility Demand Growth in Top Quartile Growth Markets
Average Compound Annual Growth Rate
Sources: Pre-2024 and latest forecast represents the average of Texas, Northern Indiana, Virginia, Georgia and Arizona. Texas: Texas represents ERCOT summer peak demand CAGR published in ’23 (’23 – ’32) vs. latest forecast as of April 2025 (’25 – ‘31). Northern Indiana: N. Indiana represents NIPSCO peak load forecast published in ’21 (roughly flat through ’40) vs. the 2024 Stakeholder Integrated Resource Plan (IRP) from October 2024. Uses a forecast period of (’23 – ’35) and does not include upside emerging load from data centers in revised case. Georgia: Georgia represents utility Georgia Power’s summer peak demand CAGR published in 2022 (’25 – ’31) vs. latest forecast published in July 2025 (’25 – ’31). Virginia: Virginia represents Dominion PJM 10-Yr summer peak demand CAGR published in ’21 vs. ’25. Arizona: Arizona represents long-term electricity sales forecast of Pinnacle West (NYSE:PNW; fully regulated electric utility serving ~1.4M customers in high-growing cities across Arizona) in ’19 vs. ’25.
July 3, 2025
Private Credit Resilience in Times of Uncertainty
July 3, 2025
Private Credit Resilience in Times of Uncertainty
- In early April, market volatility hit public credit markets hard.
- High-yield bond spreads widened sharply — one of the most significant moves in history — before recovering ~71% by early May. [ 1 ]
- But private credit markets remained resilient, operating normally.
- Further, private credit can offer stable cash flows, insulation from certain policy changes and can serve as a valuable tool for portfolio diversification. [ 2 ]
High-Yield Spreads Gap Out in One of Most Significant Moves in History
8-week Absolute High-Yield Spread Changes (in bps)
Source: Bloomberg US Corporate High-Yield Index, as of April 8th, 2025.
June 3, 2025
AI Boom Drives Data Center Growth
June 3, 2025
AI Boom Drives Data Center Growth
- Recent AI efficiency advancements like DeepSeek are driving further demand and investment in digital infrastructure.
- Amazon CEO Andy Jassy recently noted, “We continue to believe AI is a once-in-a-lifetime reinvention of everything we know, the demand is unlike anything we’ve seen before…” [ 1 ]
- The five largest hyperscalers are rapidly increasing their data center capex, expecting to invest $328B in 2025 (up 40% YoY) and $2T over the next five years. [ 2 ] [ 3 ]
- Blackstone spotted this trend early. Our ~$30B data center development pipeline is 100% pre-leased to high-quality tenants, including leading technology companies on 15+ year leases.
Data Center Capex by the 5 Largest Hyperscalers (Meta, Google, Oracle, Microsoft, Amazon)
($ Billions)
Source: Morgan Stanley, as of February 2025.


Stay up-to-date
Sign up for Blackstone Market Commentary and Pattern Recognition updates.
Important Disclosure Information
Opinions expressed reflect the current opinions of Blackstone as of the date of publishing only and are based on Blackstone’s opinions of the then-current market environment, which is subject to change. Certain information contained in the content discusses general market activity, industry or sector trends, or other broad-based economic, market or political conditions and should not be construed as research or investment advice.
Certain information and data provided in this content are based on Blackstone proprietary knowledge and data. Portfolio companies may provide proprietary market data to Blackstone, including about local market supply and demand conditions, current market rents and operating expenses, capital expenditures, and valuations for multiple assets. Such proprietary market data is used by Blackstone to evaluate market trends as well as to underwrite potential and existing investments. Additionally, certain information contained in this content has been obtained from portfolio companies and/or sources outside Blackstone, such as press releases, reports, websites, and/or articles, which in certain cases have not been updated through the date hereof. While such information is believed to be reliable for purposes used herein, no representations are made as to the accuracy or completeness thereof and none of Blackstone, its funds, nor any of their affiliates takes any responsibility for, and has not independently verified, any such information. There can be no assurances that any of the trends described herein will continue or will not reverse. Past events and trends do not imply, predict or guarantee, and are not necessarily indicative of, future events or results.
This commentary does not constitute an offer to sell any securities or the solicitation of an offer to purchase any securities. This commentary discusses broad market, industry or sector trends, or other general economic, market or political conditions and has not been provided in a fiduciary capacity under ERISA and should not be construed as research, investment advice, or any investment recommendation. Past performance is not necessarily indicative of future performance.