Essentials of Allocating to Private Assets
Private markets can be used to pursue a range of potential benefits in investor portfolios.
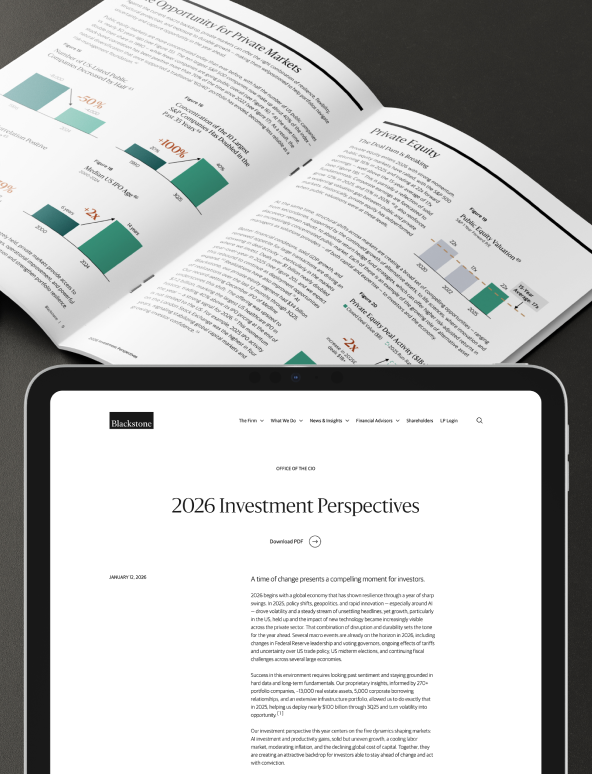
Download brochure
Introduction To Allocating to Private Assets

Allocating to Build Wealth
Asset allocation is the art of matching clients’ goals to specific mixes of investments. Private markets can be an important part of these efforts, but individual investor allocations historically have been small. That is now changing.[ 1 ]

The Case for Private Markets
Private assets historically have generated attractive risk-adjusted returns compared to public markets across cycles.[ 2 ] They have long been used by family offices, endowments, and other sophisticated investors for objectives such as capital appreciation, income generation, diversification, and inflation protection.[ 3 ]

Illustrative Allocations
Private assets can work across a range of risk profiles, but the desired allocation depends on the client’s specific objectives and circumstances. Disentangling the topics of risk tolerance and liquidity needs is key to sizing the allocation and unlocking these assets’ potential.
WHy allocate To PRIVATE ASSETS
Larger private markets allocations
historically have driven higher returns
Investors who have no allocation to private markets may be missing out on significant opportunities to potentially build wealth, as sophisticated investors such as college endowments have done for decades.
Traditional portfolios could face several challenges in the current environment, including higher and more volatile interest rates and greater inflation compared to recent decades. We believe such shifts serve to make the negative correlation between stocks and bonds less reliable.
Private markets can offer attractive characteristics, such as the potential for enhanced returns, higher income, and increased portfolio diversification, with the tradeoff of lower liquidity.
Exhibit 1: 10-Year US Foundation and Endowment Median Annual Compound Return [ 4 ]
Note: There can be no assurances that any of the trends described herein will continue or will not reverse. Past events and trends do not imply, predict, or guarantee, and are not necessarily indicative of, future events or results. Private Investments include all illiquid strategies (venture capital, non-venture private equity, private credit, private real assets, etc.).
Historical outperformance
Private growth portfolio delivered ~2x public market returns over last
20 years
One of the main attractions of private markets is
their potential for outperformance compared to
public assets.
Historically, private asset portfolios have
consistently outperformed their public
counterparts. As illustrated in Exhibit 2, an
illustrative private market growth portfolio –
designed to pursue capital appreciation – has
delivered returns that are roughly twice those of
a comparable public asset portfolio over the past
20 years.
Exhibit 2: Hypothetical Growth of $100,000
Note: Past performance does not predict future returns. This does not represent an actual portfolio managed by Blackstone. Illustrative portfolio returns are calculated based on net total returns, assuming quarterly rebalancing over the 20-year period from September 30, 2004 to September 30, 2024. Growth: (75% Equities / 25% Fixed Income). Equities is represented by the S&P 500, MSCI Emerging Markets Index and MSCI World ex US Index. Fixed Income is represented by the Bloomberg US Treasury Index (Unhedged) and Bloomberg US Corporate Bond Index (Unhedged). For Private Credit, we have used the Cliffwater Index with Blackstone’s approximate adjustment for leverage and fees. Please refer to Endnotes for definitions of public and private growth portfolio allocations. See Important Disclosure Information including “Index Comparison”, “Target Allocations” and “Trends”.
When starting out, initial considerations can include the following:
Private markets are strategic, long-term investments. They are less liquid than public markets, an important tradeoff.
Each client’s objectives and situation are unique. Advisors must understand their needs—such as liquidity and tax considerations—to tailor the right allocation.
Who you invest with matters. The difference in outcomes among private markets managers can be wide.
In addition, a robust understanding of the key attributes of private market asset classes, including how to allocate within a multi-asset class portfolio, is key.
This information is provided for illustrative purposes only and should not be considered research or investment advice.
Core Attributes of Private Assets
By using private markets, investors can pursue many of their longstanding objectives, such as capital appreciation, income generation, diversification, inflation mitigation, and tax advantages (see Exhibit 3).
Private equity, for example, can potentially offer significant capital appreciation, enhancing portfolio growth. Private credit may deliver higher income. Private real estate and infrastructure can typically provide a mix of both income and capital appreciation potential, with a degree of inflation mitigation. Private assets have the potential to provide diversification benefits. [ 5 ]
Exhibit 3: Core Attributes of Private Market Asset Classes
Note: Represents Blackstone’s view of the current market environment as of the date appearing in this material only. The above information is provided for illustrative purposes only and should not be considered as research or investment advice. Past performance does not predict future returns. There can be no assurance that any Blackstone fund or investment will be able to effectively enhance returns, increase income, provide diversification, hedge inflation, provide tax advantages, implement its investment strategy, achieve its investment objectives or avoid substantial losses. Diversification does not ensure a profit or protect against losses. Any investment involves a high degree of risk and should only be made if an investor can afford the loss of the entire investment. Blackstone does not provide tax advice. Investors should consult their own legal, accounting and tax advisers to make an independent determination of the suitability and consequences of an investment. See “Important Disclosure Information–Index Definitions” and “–Trends”.
Selecting Assets and Sizing Allocations
Private assets can be deployed across a range of risk profiles, but the desired allocation depends on the client’s specific objectives and circumstances. This includes (but is not limited to) both their risk tolerance and the proportion of their overall portfolio dedicated to private assets.
It’s crucial to distinguish between a client’s risk tolerance and their liquidity needs. These concepts are often conflated, which can lead to sub-optimal allocations. It’s important to note that higher allocations to private assets do not necessarily equate to higher risk in portfolios. [ 6 ]
With those points in mind, here are two examples to put asset allocation into action.
Note: Alternative investments involve a high degree of risk and investors may not get back the amount originally invested. There is no guarantee that any fund or investment will achieve its aims or objectives or avoid substantial losses.
Combining public and private assets
Income Portfolio
An income portfolio can be designed with private assets to pursue higher distributions. This portfolio would emphasize private credit, real assets, such as private real estate and infrastructure, and some private equity, in addition to allocation to public equity and fixed income. Allocations like this could measurably outperform a portfolio of stocks and bonds over the past two decades and deliver higher income.
Exhibit 4: Income Portfolio: Combining Public and Private Assets
Note: Past performance does not predict future returns. This does not represent an actual portfolio managed by Blackstone. The indices and benchmarks
reflected herein are not representative of all investments in the applicable asset classes, the performance of such indices and benchmarks in periods other than that the 20-year period shown herein may differ materially, and it should not be assumed that any trends shown will continue. Annualized returns and volatility are calculated based on the quarterly returns over the 20-year period from September 30, 2004 to September 30, 2024. Growth: (75% Equities / 25% Fixed Income). Equities is represented by the S&P 500, MSCI Emerging Markets Index and MSCI World ex US Index. Fixed Income is represented by the Bloomberg US Treasury Index (Unhedged) and Bloomberg US Corporate Bond Index (Unhedged). See “Important Disclosure Information”, including “Index Comparison” and ”Trends”.
Growth Portfolio
A second example – a portfolio built for growth would pursue greater capital appreciation over time. This type of portfolio would favor private equity, but also include allocations to the other three just-mentioned private asset classes.
Here, also, this style of allocation could outperform public
markets over the last 20 years.
Exhibit 5: Growth Portfolio: Combining Public and Private Assets
Note: Past performance does not predict future returns. The indices and benchmarks reflected herein are not representative of all investments in the
applicable asset classes, the performance of such indices and benchmarks in periods other than that the 20-year period shown herein may differ materially,
and it should not be assumed that any trends shown will continue. Annualized returns and volatility are calculated based on the quarterly returns over the
20-year period from September 30, 2004 to September 30, 2024. See “Important Disclosure Information”, including “Index Comparison” and “Trends”.
Considerations Before Allocating
Private market investing means active ownership of less liquid assets, as value creation takes time. Liquidity needs at the total portfolio level are one important consideration before allocating to private equity. In addition, manager selection may be of particular importance given the wider dispersion of returns compared to public markets. Key manager attributes include scale, staying power and a long track record.
Read the complete Essentials of Allocating to Private Assets
Read the complete Essentials of Allocating to Private Assets
