Insights

Portfolio Insights
Propelling the Growth of Leading Franchisors

Market Views
Market Views: Dealmaking, Disruption, and Real Estate’s Recovery

Market Views
Why Should You Care About Data Centers?
Investment Strategy
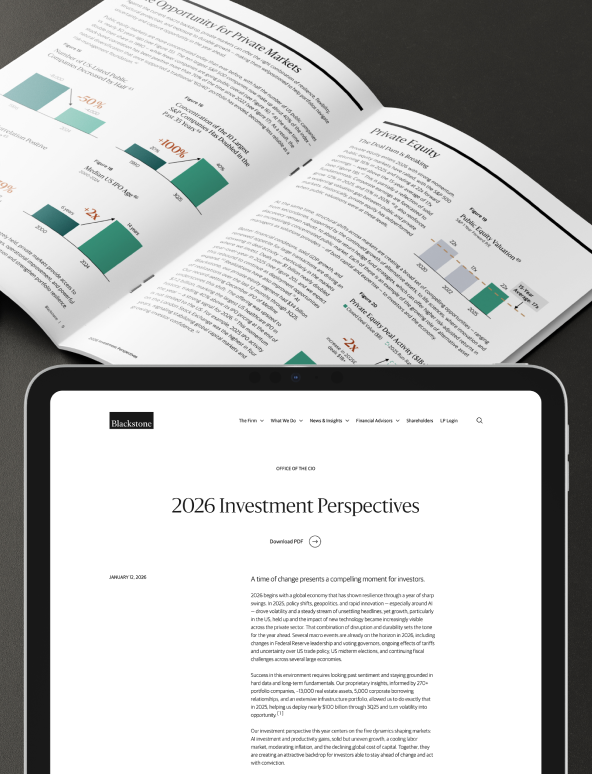
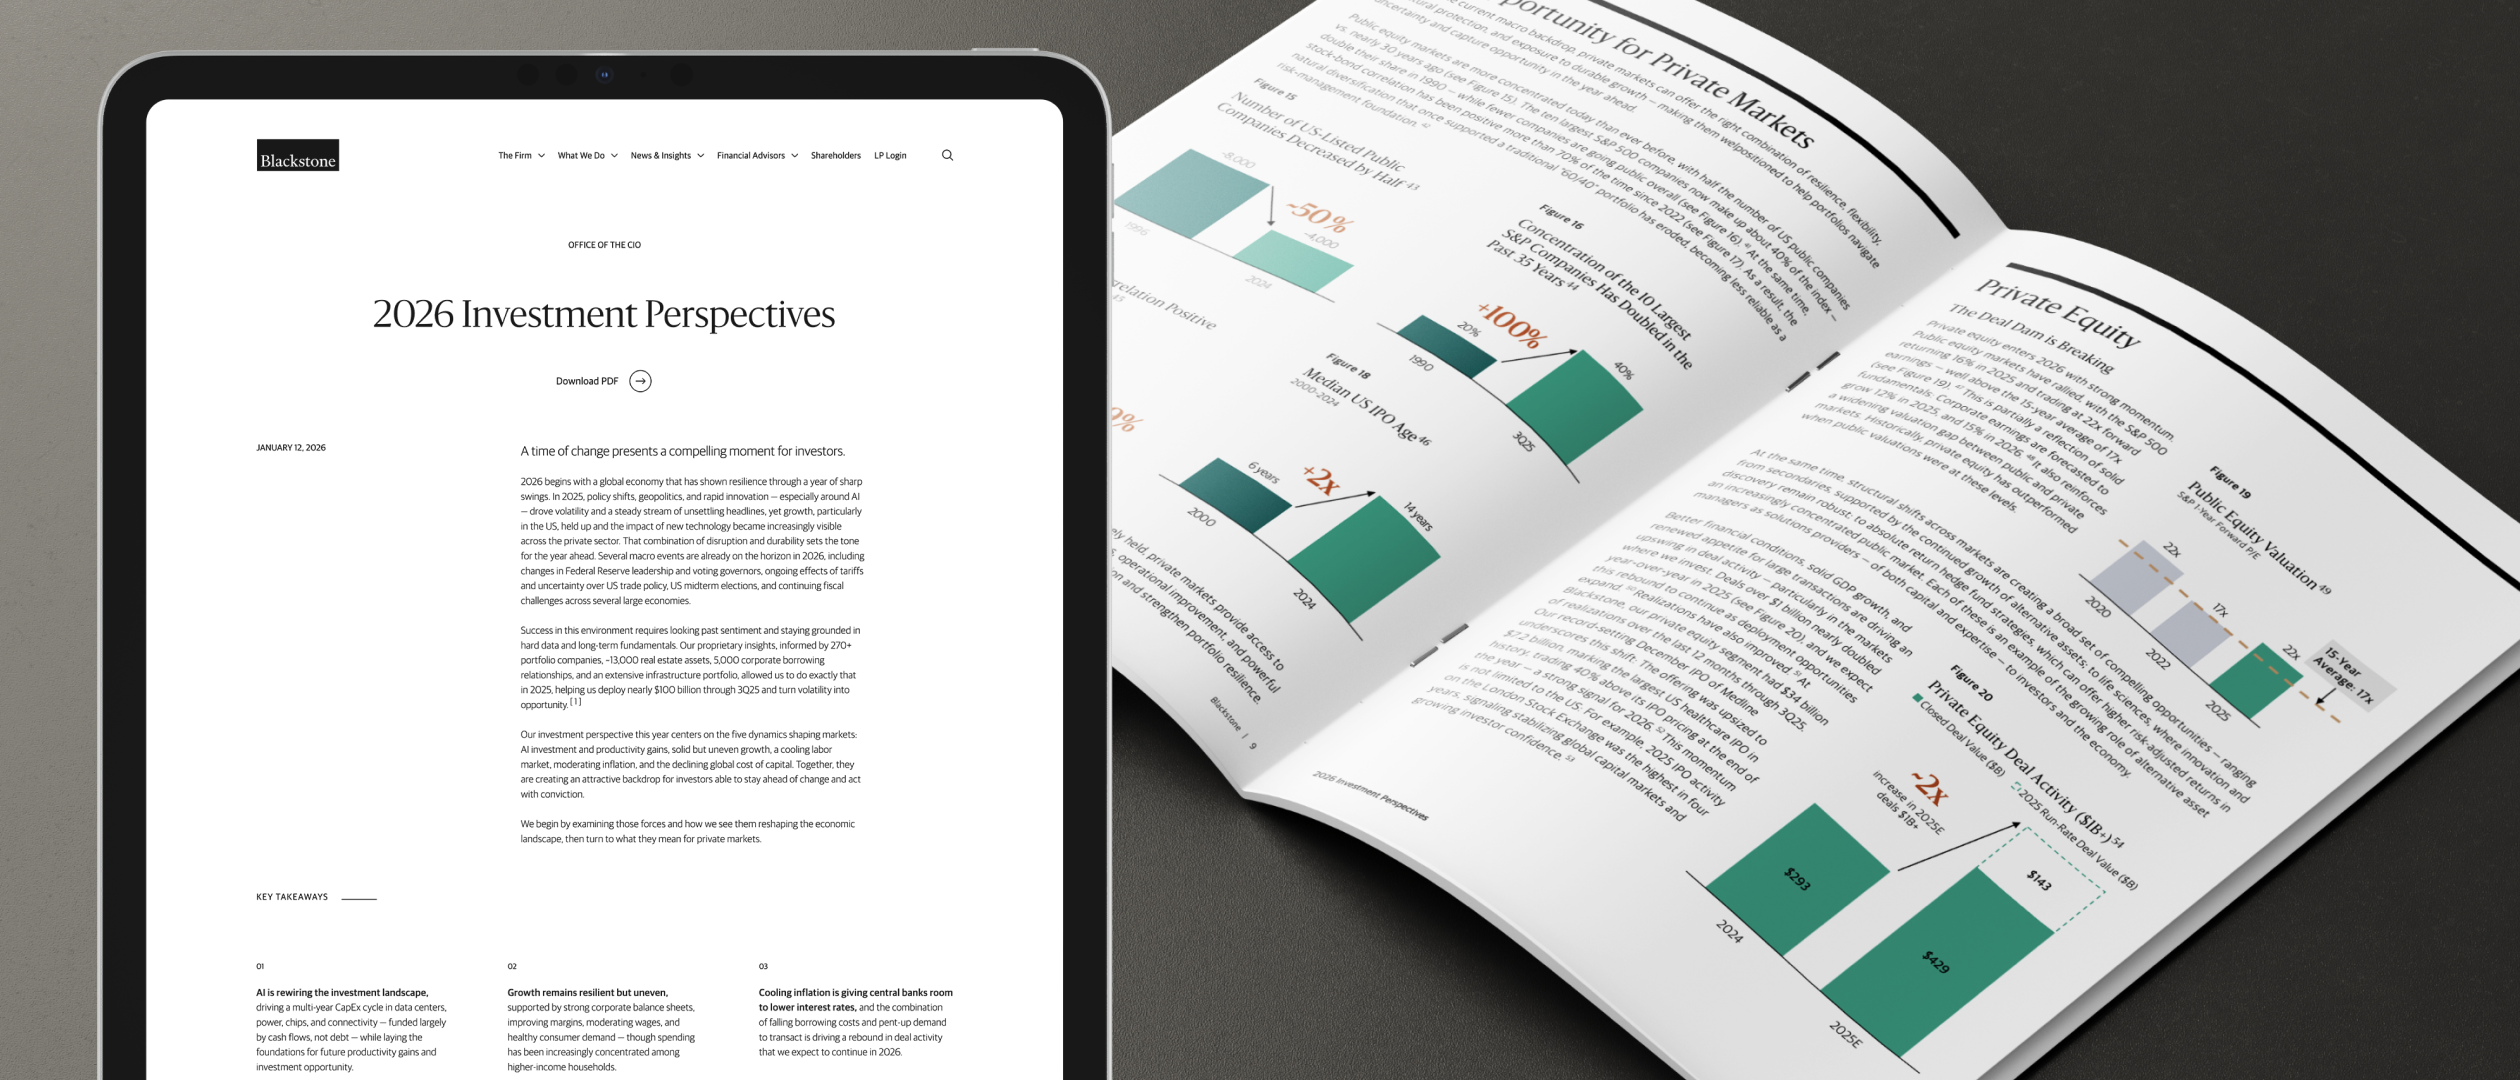
2026 Investment Perspectives

Market Views
Real Estate Enters the Next Phase of the Cycle

Portfolio Insights
Vision, Ambition, and Humanity in the Age of AI: Insights from Blackstone’s CEO Conference

Investment Strategy
Private Credit Beyond the Noise

Portfolio Insights
Behind the Scenes: Inside QTS with Farhad Karim

Market Views
The Deal Dam is Breaking

Investment Strategy
Rethinking the 60%

Market Views
Market Views: Is Everything a Bubble?

Firm News
40 Years in 40 Seconds
Insight
