Joe Zidle: Recession Signals – Still Time for Outperformance
As we go to print, the S&P 500, MSCI All-Country World Index and other major measures of risk assets are at or near all-time highs. Investors expected coordinated central bank liquidity this year, and we got it. The percentage of central banks easing monetary policy rates is at the highest level since the Global Financial Crisis in 2008.(1)
The corollary to this is that when the global economy tries to solve for anemic growth it overdoes indulgences, like excess liquidity. And it does this because a lot of other things aren’t working. That subtle point hasn’t mattered to investors this year, creating a path for equity and credit to massively outperform. Even so, without fundamental improvements in the real economy, this bull market is at risk. The good times can continue even as a recession draws closer. But for markets to have meaningful upside from here, profits growth must improve.
Monetary policy is the wrong solution From Angola to the US, central bankers are working overtime to placate investors, rather than to improve their economies. Nearly every major central bank in the world is in easing mode. Lower rates have pumped up financial assets, but have generally failed to stimulate the real economy.
Case in point: Interest rates have been negative in the eurozone since 2014, and went even more negative in September. Yet the Big 3 economies of Germany, France and Italy have added just €6 billion in new growth through the second quarter of 2019, while their stock market capitalizations increased by more than €516 billion over the same period.(2) Companies and investors have had so few investment opportunities in the real economy that they forced bond yields negative and drove stocks to record highs.
But reducing European rates to -60bps from -50bps, or taking US rates from 1.75% to 1.5%, won’t create growth opportunities. Access to loans in almost any form, whether for businesses or consumers, could hardly be any easier in the US. As one example, the percentage of loan officers who think standards are tightening has been extremely low, and at most points negative (indicating easy), since the Global Financial Crisis (Figure 1).
Figure 1: Net % of Senior Loan Officers Who Think Lending Standards are Tightening(3)
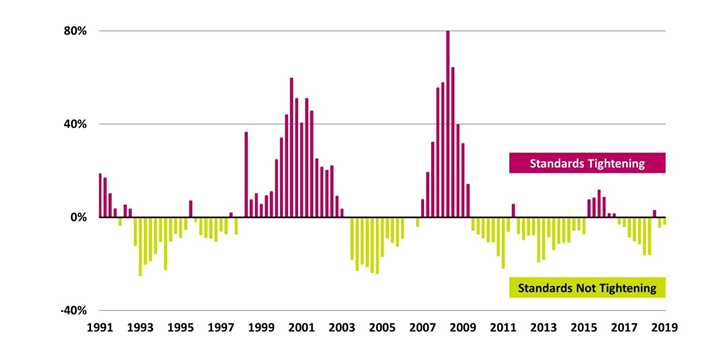
Even a year ago, when central banks were tightening monetary policy, credit conditions were not meaningfully more difficult than they are today. So, if tight credit markets aren’t the problem, easier money is unlikely to be the solution.
Trade is the real problem Most major confidence measures—be they consumer or CEO—seemed to peak when the trade war intensified in 2018. The equity market, despite its progress in 2019, is up just 4% from early 2018 before the first tariffs went into effect, and has barely beaten inflation since then. Early on in the US–China trade conflict, analysts were quick to speculate on just how insignificant the tariffs would be, given the $30 trillion of GDP produced annually between the US and Chinese economies. They also argued that the major tax break US companies had just been handed, the amount of which dwarfed the tariffs, would offset any drag from trade.
Fast forward nearly two years. The $10–30 billion of potential damage from tariffs analysts initially estimated looks inaccurate amid the second- and third-derivative effects of the dispute. The IMF has calculated that the cumulative effect of trade conflicts could result in global GDP being reduced by around $700 billion by 2020 (about 0.8% of global GDP.)(4) That’s roughly the equivalent of New Jersey’s economy (or Switzerland’s, for our more globally minded readers). In a global and interconnected world, most analysts didn’t properly consider the law of unintended consequences. Now, manufacturing sectors and capital expenditures are in recession globally, and the most trade-oriented countries are in contraction.
Perception challenges reality: theory of reflexivity in play Clients often ask whether we can “talk” ourselves into a recession. If confidence were the key to spending, they ask, will falling confidence bring the economy down with it? It’s important to consider the theory of reflexivity pioneered by famed investors George Soros in the ’90s and Howard Marks more recently.
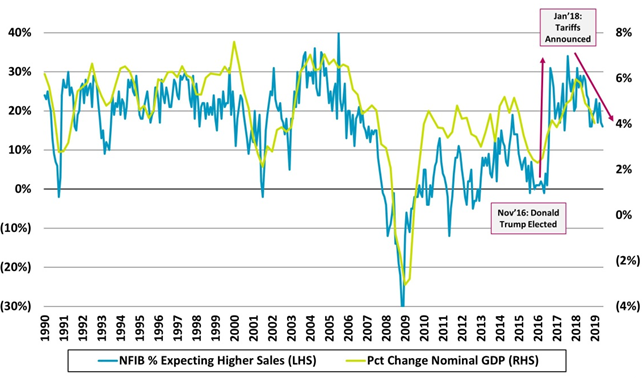
The idea is that reality and perception are not unidirectional. Sometimes perception, whether accurate or not, affects reality: like an investor’s. Today, confidence has rolled over, profits growth is in decline and capex is receding. Unless conditions change, we are also at risk of a hiring slowdown, which would affect consumer strength. Figure 2 highlights the relationship between small business sales expectations (a measure of small business confidence) and nominal GDP growth. We’ve highlighted this before, but I continue to believe it’s an important chart to monitor. As small business goes, so goes the economy.
Figure 2: NFIB Small Business Expectations and Nominal GDP Growth(5)
The good news is that we may have a temporary thaw in the US and China trade spat. It is too early to sound the “all’s clear bell,” but the two sides did commit not to escalate trade tensions further. Meanwhile, the US turned its attention to Europe. Homer Simpson once called alcohol “the cause of and solution to all of life’s problems.” Either way, that cause (or solution) is now 25% more expensive after the US imposed tariffs on European wine and whiskey. (Homer also said, “Trying is the first step to failing,” but I’d rather not share that advice with negotiators.)
Profits, rates and sentiment collide; profit growth needed Markets have priced in lower rates and can breathe a little easier when it comes to trade. A turnaround in profit growth needs to happen next for this uptrend to continue. Third-quarter earnings are set to be the third consecutive quarter with zero year-over-year (YoY) earnings growth. Thankfully, things should start to look up in the fourth quarter. Earnings growth was 16.9% YoY in Q4’2018. While very high historically, that was actually the lowest-growth quarter in 2018; the first three quarters all had growth rates of 20%–30% YoY.(6) That means the first three quarters of 2019 faced the toughest comps since this profits cycle started in 2016. Earnings are flat this year. Next year, year-over-year comps should easier.
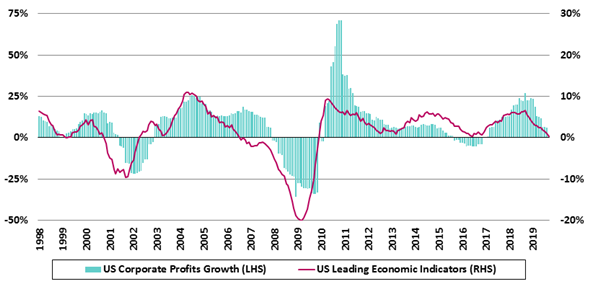
Whether corporate profits grow at 5% or at 10% next year depends on how much the economic environment stabilizes. As we’ve highlighted, when the main portion of the yield curve inverts, the macro data often start to improve. That explains why risk assets normally outperform after the curve inverts, despite the recession this move signals. Historically, the equity market rises until about six months before a recession. Two charts to watch closely are global leading economic indicators (LEIs) relative to global profit growth (Figure 3) and US leading indicators relative to the US profit cycle (Figure 4). But the yield curve has turned positive once again.
Figure 3: Global Leading Economic Indicators and Global Earnings Growth(7)
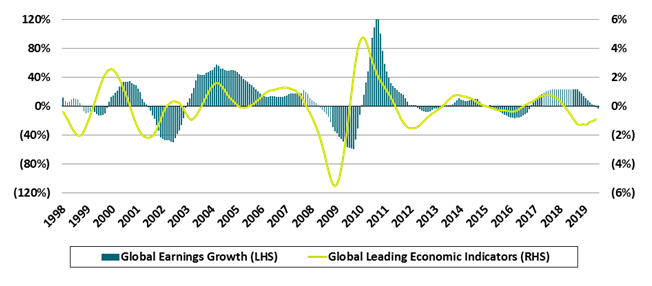
Figure 4: US Leading Economic Indicators and Profits Growth(8)
Once the 10s/2s portion of the curve inverts, history says that we have an average of 20 months before the recession starts. That suggests economic data and corporate profits have time to improve before the recession strikes. And with them will come an opportunity for further equity and credit outperformance. If LEIs turn up, profits will follow. Cyclicals and low-quality stocks should outperform in an improving earnings environment; new highs in equity markets will likely be set. This bull market is already the longest on record, and one more profit cycle before the expansion ends could crown this the largest bull market in history as well.
“Listen for Discordant Notes” Our own Steve Schwarzman’s new book, “What it Takes: Lessons in the Pursuit of Excellence,” is a great read (and the pictures are pretty good, too). For me, the chapter titled “Listen for Discordant Notes” stands out. In it, Steve describes the heady days of the housing bubble that preceded the Global Financial Crisis. He writes that when he started connecting various anecdotes from Blackstone’s different businesses, he ultimately concluded that the housing bubble would pop.
Reading this reminded me that at the end of any economic cycle, we often get warnings that appear to be unrelated. It’s in hindsight that we realize that they were not at all random. Many seemingly unrelated signs appeared during the housing bubble: skyrocketing property prices and excess speculation on raw land, the failure of auction rate securities, a money market fund breaking the buck (i.e., when its net asset value falls below one dollar) and the failure of an asset-backed hedge fund. In retrospect, the role that each of these phenomena played in the ensuing meltdown was obvious.
As readers may know, I’ve turned more bearish on the current economic outlook. I don’t expect a recession in six months, but I don’t think it will be as far out as two years from now, either. Readers may also know that I believe excess sovereign debt might be the mother of all bubbles. The late-August yield curve inversions force me to listen for the discordant notes of our time. The curve’s inversion won’t tell us what is wrong, only that something is wrong. The failures in the repo market, negative-yielding debt, a deeply negative term premium, trade conflicts around the world and a collapse in manufacturing all seem unrelated right now, but I don’t think they are random.
Every cycle ends with excesses. The warnings are normally subtle and usually dismissed. This cycle’s excess is sovereign debt.
Footnotes:
- NDR and Haver Analytics, as of 10/24/19.
- Bloomberg, Eurostat and Federal Reserve. Represents real GDP growth, seasonally adjusted for each country. Market capitalizations represent the MSCI Germany Index, MSCI France Index and MSCI Italy Index. All data for the period 1/1/19 through 6/30/19.
- Bloomberg and Federal Reserve, as of 9/30/19. Based on “C&I Loans for Large/Medium” from the Senior Loan Officer Opinion Survey on Bank Lending Practices.
- Source: IMF staff estimates, as of 10/8/19. Losses are estimated relative to a scenario of no tariff hikes.
- Bureau of Economic Analysis and National Federation of Independent Business. NFIB data as of 9/30/19, GDP data as of 6/30/19.
- I/B/E/S data from Refinitiv, as of 10/24/19.
- Bloomberg and OECD. Global Earnings Growth data as of 9/30/19, represents the year-over-year change in TTM EPS for the MSCI ACWI Index. Global Leading Economic Indicators as of 8/31/19, represents the average YoY change in LEIs for over 30 countries.
- Conference Board and Bloomberg, as of 9/30/19. US Corporate Profits Growth represents the year-over-year change in TTM EPS for the S&P 500. US Leading Economic Indicators represents the year-over-year change in the Conference Board US Leading Index Ten Economic Indicators.
The views expressed in this commentary are the personal views of the author and do not necessarily reflect the views of The Blackstone Group Inc. (together with its affiliates, “Blackstone”). The views expressed reflect the current views of the author as of the date hereof and Blackstone undertakes no responsibility to advise you of any changes in the views expressed herein. For more information about how Blackstone collects, uses, stores and processes your personal information, please see our Privacy Policy here: http://go.pardot.com/e/213192/privacy/68f9x/182811975?h=L3PDlTnbE2h0R6yw-jpiXWquHwiOdKAOzy99H3DK9f8.
Blackstone and others associated with it may have positions in and effect transactions in securities of companies mentioned or indirectly referenced in this commentary and may also perform or seek to perform services for those companies. Investment concepts mentioned in this commentary may be unsuitable for investors depending on their specific investment objectives and financial position.
Tax considerations, margin requirements, commissions and other transaction costs may significantly affect the economic consequences of any transaction concepts referenced in this commentary and should be reviewed carefully with one’s investment and tax advisors. All information in this commentary is believed to be reliable as of the date on which this commentary was issued, and has been obtained from public sources believed to be reliable. No representation or warranty, either express or implied, is provided in relation to the accuracy or completeness of the information contained herein.
This commentary does not constitute an offer to sell any securities or the solicitation of an offer to purchase any securities. This commentary discusses broad market, industry or sector trends, or other general economic, market or political conditions and has not been provided in a fiduciary capacity under ERISA and should not be construed as research, investment advice, or any investment recommendation. Past performance is not necessarily indicative of future results.