Joe Zidle: This is a Bull’s Dream


By Joe Zidle, Investment Strategist
With this bull market officially becoming the longest in history, a jittery investing public reasonably raises concerns that this marathon may soon come to an abrupt finish line. While media reports indicate a bullish view among investors (“Investors Haven’t Been This Bullish on U.S. Stocks since 2015,” Bloomberg, August 14, 2018), longer-term positioning does not support the argument that stocks are currently over-owned. Since this bull market started in 2009, investors have consistently reduced their exposure to equities while allocating capital just about everywhere else, including record inflows to fixed income.
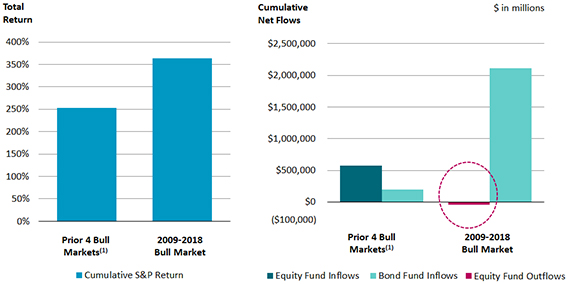
History shows bull markets end with hubris, not humility Investor activity through the course of this bull market has been different from other recent bull markets. In previous bull markets (1982–1987, 1987–1990, 1990–2000, and 2002–2007) investors embraced equities slowly at first but flows accelerated as markets peaked; in this market, investors have generally been sellers (chart below). With memories of the Great Recession, investors may be plagued by a nagging fear that something will go wrong again. In economic terms it is called a “recency bias”: a phenomenon where one assumes what happened in the recent past will occur again shortly. At current rates, equity fund outflows for 2018 are poised to be the highest since 2012, underscoring investor angst.
Market Returns and Fund Flows in Bull Market Periods

The cost of allocating to traditional fixed income is going up Rising CPI, wages, oil & gas prices coupled with further Fed rate hikes will likely push interest rates higher. For that reason, the decision to remain overweight fixed income and underweight equities could become even more costly. There are asset classes and strategies that historically have provided a measure of security against rising rates, such as floating rate senior loans and high yield, real estate leases and generally shorter-duration investments. But data shows that certain equity sectors have a higher positive correlation to rising yields, especially among cyclical sectors such as energy, financials, materials and commodities. In fact, cyclicals have annualized total returns of 31.2% in periods of rising rates, compared to broader market returns of 22.2% over the same periods.(2)
More investors seem to be looking to get out than get in The number one question I’ve faced recently in my discussions with clients and advisors is when this bull market will end. An inverted yield curve is historically a good predictor, as are rising unemployment, weakening Leading Economic Indicators (LEIs) or euphoric inflows. None of these are on the immediate horizon. Instead, we see strong balance sheets, accelerating earnings growth, relatively low interest rates and skeptical investor positioning.
1. Flows and performance represent the average of the following bull market periods: 1982–1987, 1987–1990, 1990–2000 and 2002–2007.
2. Source: Bloomberg and Federal Reserve. Reflects periods between October 5, 1998 and December 15, 2016 in which US Treasury Yields have increased by 120 bps or more. Market returns represented by the S&P 500 Index. The S&P 500 returned annualized total returns of 6.6% across the full period, while cyclicals returned annual total returns of 7.5% over the same. All returns are annualized and reflect dividend reinvestment.
The views expressed in this commentary are the personal views of the author and do not necessarily reflect the views of The Blackstone Group L.P. (together with its affiliates, “Blackstone”). The views expressed reflect the current views of the author as of the date hereof and Blackstone undertakes no responsibility to advise you of any changes in the views expressed herein.
Blackstone and others associated with it may have positions in and effect transactions in securities of companies mentioned or indirectly referenced in this commentary and may also perform or seek to perform services for those companies. Investment concepts mentioned in this commentary may be unsuitable for investors depending on their specific investment objectives and financial position.
Tax considerations, margin requirements, commissions and other transaction costs may significantly affect the economic consequences of any transaction concepts referenced in this commentary and should be reviewed carefully with one’s investment and tax advisors. All information in this commentary is believed to be reliable as of the date on which this commentary was issued, and has been obtained from public sources believed to be reliable. No representation or warranty, either express or implied, is provided in relation to the accuracy or completeness of the information contained herein.
This commentary does not constitute an offer to sell any securities or the solicitation of an offer to purchase any securities. This commentary discusses broad market, industry or sector trends, or other general economic, market or political conditions and has not been provided in a fiduciary capacity under ERISA and should not be construed as research, investment advice, or any investment recommendation. Past performance is not necessarily indicative of future performance.


