Joe Zidle and Byron Wien: On Underwriting a Square Root Recovery
As the world continues to deal with the effects of COVID-19, racial injustices and rising geopolitical tensions, recent data signal that the worst of the economic damage is likely behind us. Data show sequential improvement for most of the world’s key economies, a trend that will probably continue in the short term. Longer-term, there’s an emerging consensus for a quick and complete recovery, but my partner Byron and I have a different view.
We believe that we’re past the cycle low for the economy and the financial markets, and that the recovery is under way. However, we suspect the speed and magnitude of the global policy response are responsible for the rapid transition into recovery mode. In fact, we may end up experiencing the shortest recession in history, beating the brief six-month recession in 1980. COVID-19 is extraordinary in many ways, the market’s ebbs and flows included. The S&P 500® recorded the fastest peak to bear market decline and the fastest bear market exit ever. The Dow Jones Industrial Average recorded the shortest bear market in history at just three days.1
Despite this, we caution people from making the wrong conclusions based on the massive scope of the global policy response, and we advise against annualizing temporary spending programs and one-time payouts. Some forms of temporary spending may become permanent, but we doubt government spending will double in size permanently. In short, we don’t expect a “V-shaped” recovery. We anticipate a recovery cycle that is both unique to COVID-19 and reminiscent of recessions past.
A Recovery Diagnosed
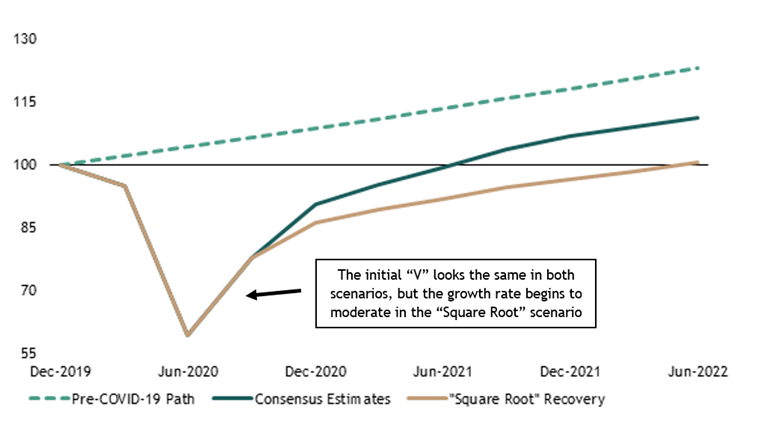
We predict a “square root-shaped” recovery Initially, a “V-shaped” and “square root-style” recovery will look identical. The early phase of the recovery, probably lasting through the summer, will be “V-shaped,” followed by a gradual rise in the fall and beyond. However, we expect momentum to slow after the initial reopening of the economy. The most recent GDP forecast revisions are now projecting that the economy will completely recover 2019 levels by 3Q’21.2 We advise caution on this point; month-over-month or quarter-over-quarter comparisons reflect increases from depressed levels. We believe there is some long-term scarring to the economy, much of which won’t be evident immediately.
For instance, Chapter 11 bankruptcies and corporate defaults have been modest so far. Rating agencies are monitoring indebtedness, and weakness in second quarter earnings could trigger another wave of issuer downgrades. However, bankruptcies typically don’t peak until after a recession ends. Only in hindsight can we fully understand the damage. And we believe that the lockdown’s final toll will be greater than consensus expects.
GDP bounceback a 2022 proposition We don’t expect the economy to return to 2019’s GDP level until 2022. It usually takes several years for the economy’s post-recession recovery to return to its pre-recession pace. Growth rates may look nearly identical after the initial bounce, but as we plot economic activity levels, we see a path below pre-COVID levels for some time to come.
Figure 1: Illustrative Growth Paths for US Real GDP3
(indexed to 100 as of 12/31/19)
COVID cases likely to rise, but not to a “second wave” level that requires a widespread lockdown The highly communicable nature of COVID-19 combined with social-distancing fatigue means that the number of COVID-19 cases should continue to rise during the recovery. However, policymakers now have a greater understanding of how the virus behaves after tracking, to date, more than 2.4 million cases in the US and in excess of nine million cases globally. The policies enacted in the early days of this pandemic were informed by the rapid case growth. Now, real-world evidence based on hospitalizations and ICU capacity is likely to inform more targeted and effective responses to control the spread.
Unemployment will improve, somewhat We expect the unemployment rate to gradually come down to 10%, but we think it will remain elevated for some time as firms permanently close or go bankrupt. More than 30 million Americans were unemployed at the bottom of the recession, and we estimate only around 20 million of them are likely to return to work in the near term. Businesses won’t reinstate 100% of their original workforce to service only 90% of the original demand. Also, in many instances, the lockdown taught companies that they are able to operate effectively with fewer workers.
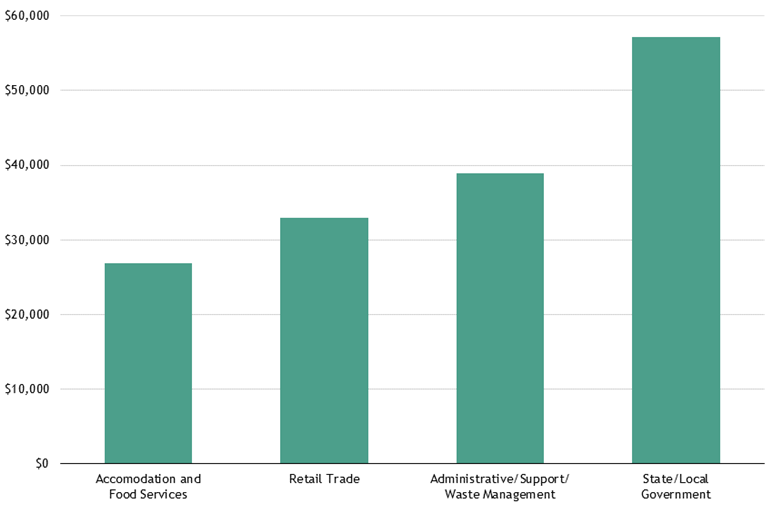
As a result, we have our eye on state and local municipalities, which will need to lower their ranks to compensate for lower tax receipts. A quarter of local government leaders expect to lay off staff, according to recent surveys by the National League of Cities and the United States Conference of Mayors.4 Reflecting on the Global Financial Crisis, we highlight two critical outcomes: 1) State and local government layoffs began almost one year after the recession ended, and 2) half of the layoffs were teachers.5 According to the Bureau of Labor Statistics (BLS), nearly 20 million people work for some branch of state/local government, with an average annual wage of over $57,000.6 This cohort earns more than the average American worker, and substantially more than low-income wage earners in services industries that were particularly hard-hit by the shutdown (see Figure 2). Government employees who lose their jobs may not return to the workforce as quickly as many of the workers who were laid off or put on furlough during the early days of the pandemic.
Figure 2: Average Annual Wage for State/Local Government vs. Selected Sectors7
(selected sectors represent those with the highest share of job losses from March 2020 to May 2020)
Consumers to proceed with caution Early data indicate consumers aren’t buying the recovery just yet. We expect the savings rate to remain elevated, travel to be restrained, and older, more vulnerable people to spend more time at home until a cure or vaccine is available. The repercussions of this last trend will be significant: people over the age of 65 represent over 20% of discretionary spending in the US.8
More broadly, there is a linear relationship between savings and the size of the economy. Every 1% increase in the savings rate is roughly equivalent to an 80bps reduction in the size of the economy, all else equal. A savings rate settling above the pre-COVID level of 7.9% would prevent the economy from returning to full strength. We often hear talk of “precautionary savings,” but that isn’t a new concept. Historically, the savings rate rises about 200bps following a recession. We doubt this time will be different, at least directionally.
In-person face time still preferred Remote working and remote learning proved reasonably effective, but we believe people want to interact and exchange ideas with each other. We expect offices and schools will resume face-to-face experiences over the next year.
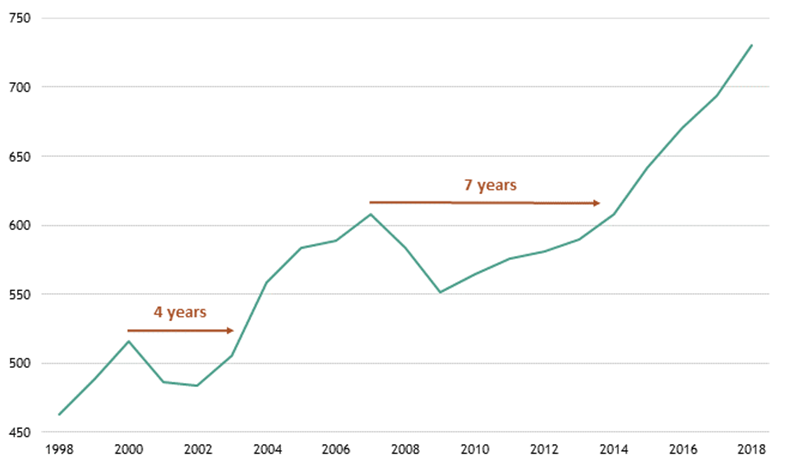
People won’t rush back to face-to-face interactions in all instances, however. For example, global business travel will likely remain depressed for some time. This is significant, given the industry is worth over $1 trillion per year, according to the Global Business Travel Association. After the last two recessions, it took 5.5 years for US passenger airmiles flown to recover pre-recession levels (see Figure 3).9 This reality is taking hold in analysts’ forecasts for the global air transport industry, which had revenues of $838 billion in 2019 but are expected to contract by 50% this year.10
Figure 3: US Passenger Airmiles Flown after 2001 and 2008 Recessions9
(airmiles in billions)
Vaccine-hopeful, but patience required We are hopeful that important progress will be made in managing the symptoms of COVID-19 by the end of this year. But it will take time for a vaccine to be developed, tested, manufactured in large quantities and distributed widely. Signs are encouraging that significant progress on this front will take place by the end of 2021.
Investment Themes Come into Focus
Historically, trends going into global health emergencies are the same trends coming out of them. In the struggle against the coronavirus, several new trends should be considered as well, two of which we focus on here. First, zero rates, a new phenomenon in the US, will challenge savers to find other sources of income. Second, after nearly 80 countries restricted exports of pharmaceuticals and protective equipment, the US finds itself needing to revamp its medical supply chain. Alongside existing themes like housing and technology, trends which appear to be accelerating due to strong fundamentals, new COVID-era themes bear watching as the economy recovers.
Yield a scarce commodity The Fed Funds rate is projected to remain at zero until at least 2022, according to Federal Reserve Chairman Jerome Powell. Yet experiences from Japan and Europe indicate that when rates hit zero, they can stay there for much longer than expected. Japan took its rates to zero in 1995 and Europe did so in 2014.
One important issue raised in my recent meetings that isn’t receiving as much attention is how the collapse in interest rates affects the income and savings needs of those in or approaching retirement. According to the Census Bureau, there are 73 million baby boomers in the US, and 10,000 of them celebrate their 65th birthday every day. The youngest baby boomer, who, incidentally, was born on December 31, 1964 at 6:45pm local time in Hawaii, will turn 65 in 2030.
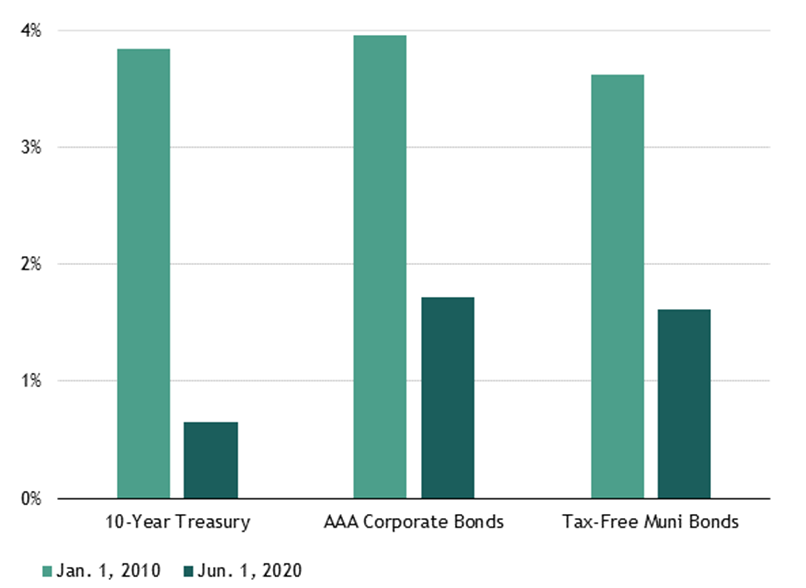
That’s a long time from when the boomers started to retire in 2010 and the yield on a 10-year Treasury bond or AAA corporate bond was approximately 4% and the average for tax-free municipal bonds was around 3.5%. Those rates are in stark contrast to today’s yields, as Figure 4 shows.
Figure 4: Yields When the First Boomer Retired (2010) vs. Yields Today11
In their 2018 book, Rescuing Retirement, Blackstone Executive Vice Chairman Tony James and labor and retirement scholar Teresa Ghilarducci warned of the crisis facing retirees. The combination of populations living longer and saving less presented significant challenges even before the Fed anchored interest rates at zero. Now, 90% of government bonds in advanced economies yield less than 1%.12 Ultra-low interest rates are depressing returns on the already-meager savings that retirees have put aside. This means investment income is increasingly scarce, even as it becomes more important. In my opinion, high-quality and alternative forms of fixed income – real estate and credit strategies among them- will see strong demand as long as rates remain low.
Medical supply chain security revamp A second secular investment theme involves opportunities to re-shore parts of the US medical supply chain. Labor and other cost advantages drove manufacturing out of the US, and we expect focused policy efforts to incentivize companies to reconfigure supply chains and balance efficiency with resiliency.
The White House and Washington policymakers are intensifying their focus on mitigating medical supply chain risks. The President has already signed two executive orders involving the Defense Production Act (DPA) and the International Development Finance Corp (DFC) that relate to the strategic production of resources. Policy analysts believe additional administrative action is being considered that would allow the FDA to speed up its approval processes and further facilitate onshoring. On the congressional side, over 20 bills have been introduced in the Senate and House to address potential risks in the US supply chain.
Shifting supply chains back to the US is a monumental task. For example, industry groups estimate that building a generic drug manufacturing facility can take 5-7 years and cost up to $1 billion.13 Factories also require large footprints and, preferably, low-cost labor, as well as guidance on environmental regulations that govern the handling and disposing of toxic chemicals. It can be done, of course. In the 1970s, Congress passed tax breaks that turned Puerto Rico into a primary manufacturer of US drugs, which lasted until the mid-1990s when the benefits were eliminated.But there is only so far private companies will go without government leadership; otherwise, they risk trying to push through higher prices. Onshoring will take a concerted government effort. Tax and investment structures will be critically important in minimizing the effect on prices paid by consumers and health care providers. For example, under a plan proposed by generic drug manufacturers, Health and Human Services (HHS) would issue guaranteed long-term price and volume contracts for certain high-priority medicines. The plan would also give HHS the power to issue grants to support the construction of facilities, establish tax incentives and facilitate regulatory efficiencies.
A Long Road Ahead
Currently, we are in a sweet spot for economic data releases, where sequentially improving data support prospects for a rapid global recovery. But there are longer-term issues that extend beyond the reach of weekly and monthly data releases. To name a few, we see increased stress on households due to a delayed return to full employment, economically motivated re-openings that fail to restore confidence in people who feel shaken by the pandemic, and setbacks and uncertainty in the quest for a vaccine. But we believe that focusing on—and understanding—the shape of the recovery can help our stakeholders correctly seize the momentum while protecting against investment decisions that will ultimately disappoint.
As always, we are here to talk. Stay tuned for announcements about our next quarterly webinar scheduled for the week of July 13th.
With data and analysis by Taylor Becker.
- Based on 20% recovery from the trough of the DJIA.
- Bloomberg, based on all economic forecasts updated on 6/15/20 or later, as of 6/22/20.
- Bloomberg, based on all economic forecasts updated on 6/15/20 or later, as of 6/22/20. “Square Root” recovery is illustrative only. “Pre-COVID-19 path” represents constant annual growth at 2.1%.
- National League of Cities and the United States Conference of Mayors, as of 4/14/20.
- Census Bureau analysis, as of 10/17/19.
- Bureau of Labor Statistics, wage data represents the weighted average annual wage of state and local government workers, based on the current Occupational Employment Statistics report (May 2019), as of 6/26/20.
- Bureau of Labor Statistics, wage data represents the annual mean wage of each sector, based on the current Occupational Employment Statistics report (May 2019), as of 6/23/20. Selected categories represent the sectors with the largest share of private job losses over the period March 2020 through May 2020, excluding the health care and social assistance sector.
- Bureau of Labor Statistics, based on the current Consumer Expenditure Survey (2018), as of 6/26/20.
- Bureau of Transportation Statistics, based on all US passenger-miles on certificated, domestic air carriers.
- International Air Transport Association, as of 6/9/20.
- Bloomberg, as of 6/1/20. Represents yields for generic 10-year US Treasury bonds, and yield to worst for the Bloomberg Barclays Aaa Corporate Total Return Index and the Bloomberg Barclays Municipal Bond Index.
- IMF, Bloomberg and Deutsche Bank Global Research, as of 6/1/20.
- Association for Accessible Medicines, as of 4/30/20.
The views expressed in this commentary are the personal views of Byron Wien and Joe Zidle and do not necessarily reflect the views of The Blackstone Group Inc. (together with its affiliates, “Blackstone”). The views expressed reflect the current views of Byron Wien and Joe Zidle as of the date hereof, and none of Byron Wein, Joe Zidle or Blackstone undertake any responsibility to advise you of any changes in the views expressed herein.
Blackstone and others associated with it may have positions in and effect transactions in securities of companies mentioned or indirectly referenced in this commentary and may also perform or seek to perform services for those companies. Investment concepts mentioned in this commentary may be unsuitable for investors depending on their specific investment objectives and financial position.
Tax considerations, margin requirements, commissions and other transaction costs may significantly affect the economic consequences of any transaction concepts referenced in this commentary and should be reviewed carefully with one’s investment and tax advisors. All information in this commentary is believed to be reliable as of the date on which this commentary was issued, and has been obtained from public sources believed to be reliable. No representation or warranty, either express or implied, is provided in relation to the accuracy or completeness of the information contained herein.
This commentary does not constitute an offer to sell any securities or the solicitation of an offer to purchase any securities. This commentary discusses broad market, industry or sector trends, or other general economic, market or political conditions and has not been provided in a fiduciary capacity under ERISA and should not be construed as research, investment advice, or any investment recommendation. Past performance is not necessarily indicative of future performance.